Quota Forms
Application to Transfer Underproduction Credits
Application to Transfer Total Production Quota
Quota Exchange: Offer to Sell Quota
Quota Exchange: Bid to Buy Quota
Quota Exchange and Credit Transfer Results
Understanding the Alberta Milk Quota Exchange
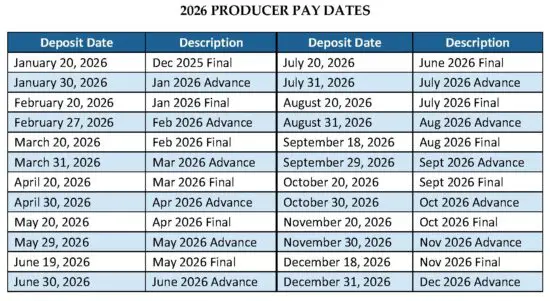
2026 Quota Deadlines and Pay Dates
Quota Credit and Transfer Summaries
2026
July
June
May
April
March
February
January
2025
December
November
October
September
August
Historical Quota Values
Historical Quota and Incentive Day Adjustments
Provincial Milk Quality Averages
Month |
Bacteria Average (IBC) – cells/mL |
Somatic Cell Count (SCC) – cells/mL |
| 2026 | ||
| June | 15,579 | 169,908 |
| May | 14,208 | 160,883 |
| April | 14,911 | 156,847 |
| March | 14,448 | 160,129 |
| February | 14,195 | 160,268 |
| January | 16,377 | 162,406 |
| 2025 | ||
| December | 14,548 | 160,627 |
| November | 15,296 | 162,299 |
| October | 14,936 | 172,001 |
| September | 15,123 | 187,680 |
| August | 17,826 | 191,796 |
| July | 17,596 | 187,557 |
| June | 16,290 | 181,781 |
| May | 15,672 | 170,836 |
Producer Pay Schedule
Producer Policy Handbook
*NOTE: There are no changes for 2026, please continue to use the 2024 Producer Policy Handbook.
Highlight of Changes to the 2024 Producer Handbook
2026 Quota Exchange Dates
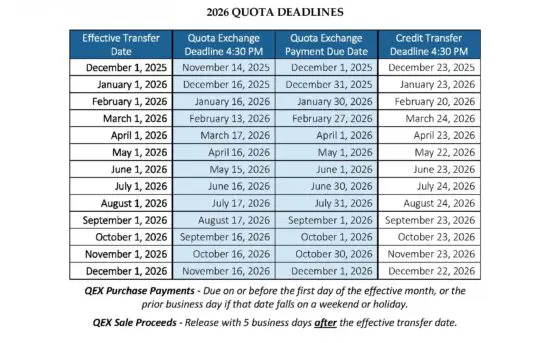
Completed forms must be received by Alberta Milk prior to 4:30 p.m. on the deadline.
Quota and Milk Production Summary
Producer Pool Additions/Deductions
Provincial Average Components
Month |
Butterfat (kg/hL) |
Protein (kg/hL) |
Other Solids (kg/hL) |
| 2026 | |||
| June | 4.2978 | 3.2880 | 5.9526 |
| May | 4.3451 | 3.3168 | 5.9303 |
| April | 4.4586 | 3.3741 | 5.9369 |
| March | 4.4847 | 3.3753 | 5.9351 |
| February | 4.4823 | 3.3547 | 5.9416 |
| January | 4.5184 | 3.3857 | 5.9405 |
| 2025 | |||
| December | 4.5501 | 3.4287 | 5.9341 |
| November | 4.5536 | 3.4326 | 5.9212 |
| October | 4.4809 | 3.3946 | 5.9158 |
| September | 4.3217 | 3.3011 | 5.9235 |
| August | 4.2636 | 3.2686 | 5.9198 |
| July | 4.2505 | 3.2589 | 5.9265 |
| June | 4.2659 | 3.2764 | 5.9390 |
Average Milk Prices
2026
June- $98.8341
May- $99.7157
April- $101.9333
March- $100.5337
February- $95.1182
January- $97.8566
2025
December- $97.7369
November- $99.7953
October – $100.7041
September – $ 96.1150
August – $ 94.2223
July – $95.8154
June – $95.7651
May – $99.0220
April – $ 99.3831
March – $98.4705
February – $99.5549
January – $ 99.4394